


According to National Geographic, 18 billion pounds of plastics spill into our oceans every year from coastal areas worldwide.
Think about the amount of plastic you consume as an individual. Now think about that amount multiplied by every person in your city, district and country — not to mention the global plastic consumption of the entire world.
When we pick up a bottle of water to drink or a punnet of raspberries to eat, we rarely stop to ponder just how damaging these quick lunchtime fixes are to the planet. Today, it’s time to face facts as we show you just how much plastic packaging is made annually, via some of the best sources for statistics on the web.
Here are five of our favourite online resources that show the reality of plastic packaging waste. After reading about them, you can visit the pages for yourself to get clued up on the amount of plastic we generate and use every year.
Eurostat — Packaging Waste Statistics
If you simply Google the question, “how much plastic packaging is made every year?” Eurostat will come out on top. The data website states that per inhabitant, 169.7kg of packaging waste was generated in 2016. Comparatively, only 114kg was ultimately recycled, leaving 55.7kg of packaging unaccounted for. If we take this data and apply it to the UK (which has a population of around 66 million people in 2020), you can only begin to imagine what the total packaging waste would equate to.
If you want to review how waste was generated, recovered and recycled since 2007, you can do so by viewing Eurostat’s interactive graph.
It’s worth noting this data only refers to European Union countries, meaning packaging waste per person could be much higher in other parts of the world — such as in the United States. Plus, packaging waste is surveyed generally, not just in terms of plastic.
Read Eurostat’s Packaging Waste Statistics
Plastic Oceans — the Facts
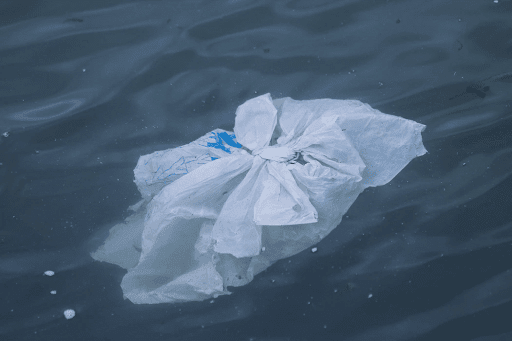
As you can imagine, plastic pollution is something this environmental organisation is passionate about abolishing for good. Their page full of facts about plastic waste and plastic production is a great resource if you’re looking to learn about how waste packaging impacts marine life.
Perhaps one of the most shocking statistics is this: “More than 8 million tonnes of plastic are dumped into our oceans every year.” Although this doesn’t necessarily tell us just how much packaging is created each year, it does give us an insight into the poor waste management of plastic waste and just how little plastic is successfully recycled.
As we know, recycling plastic is difficult due to its durability and chemical make-up. This is true of particularly brittle plastics used to create plastic bottles and plastic bags. As such, Plastic Oceans has collected a whole host of statistics on plastic bottles, highlighting why this specific product is a huge issue. Here are some of the most impactful statistics shown on their page:
- Over 100 billion bottles were sold in the United States in 2014. Per person, this equals around 315 bottles on most days of the year.
- Nearly 15% of all waste comes from this product, making it one of the most short-lived and dangerously disposed of items.
Plastic Ocean’s facts haven’t gone unnoticed. Since this webpage was published, we’ve seen a huge rise in drinking bottles made of alternative materials such as aluminium and metal. Plus, we saw a ban on plastic bags in several countries and taxation on products like this in others.
Read Plastic Ocean’s The Facts
Eurostat — How Much Plastic Packaging Waste Do You Produce?
Eurostat has produced more than one striking piece of data to shed light on the plastic pollution crisis. As well as posting the aforementioned graph on EU waste, Eurostat published an interactive asset on the circular economy showing plastic packaging’s journey from creation to eventual disposal. This striking visual of waste management and plastic’s short lifecycle is a great way to help others visualise their role in plastic pollution, as well as learn how plastic interacts with the atmosphere — before and after you come into contact with it.
At the start of their interactive asset, Eurostat sums up the weight of the plastic problem by claiming in an average year, the EU alone generates 15.8 million tonnes of plastic packaging. The study also forewarns us that even though some countries tend to produce more plastic waste than others, every EU Member state has steadily increased their plastic consumption over the last decade. Being upfront about scary stats like this makes plastic pollution a shared responsibly, keeping us all accountable for our own waste management and recycling activities.
There are gems to be found everywhere in this data set — but we found it particularly useful to see how plastic packaging stacks up against different types of packaging in the asset’s waste management section. For example, plastic packaging products are only recycled 41.9% of the time, compared to overall packaging products, which are recycled around 70% of the time. We think this type of graph offers up a solution, rather than solely focusing on the problem. Clearly, to wipe out plastic pollution, we must look at the benefits of using another material that is more widely recycled.
The whole purpose of the data is to prove we should be working towards a circular economy — as opposed to a linear supply chain — where the value of products is continually recycled. The result is that waste is reused and there is less reliance on single-use products that likely end up in our oceans.
Read Eurostat’s How Much Plastic Packaging Waste Do You Produce?
Our World in Data — FAQs on Plastics
As the publication’s name suggests, Our World in Data is an impartial data website that publishes statistics on anything and everything. In this FAQ, the focus is on plastics.
This page is packed with data (as you’d expect) yet it is straightforward to navigate. The first section tells you everything you need to know about global plastic production. To sum it up:
- The world produced 2 million tonnes of plastic in 1950, which has now risen to 381 million tonnes
- Plastic waste per person usually correlates with a country’s income. If the national income is high, so is the amount of plastic consumed per person in that country
- Poor waste management seems to stem from low-income coastal countries
Although this piece seems to answer our questions quite early on, the knowledge you can gain from this resource just keeps on giving. There are questions about plastic production, the effect plastic has on our oceans and about domestic plastic recycling.
Read Our World in Data’s FAQ on Plastics
National Geographic – Facts about Plastic Pollution
If you’re looking for something a bit more visual, National Geographic has produced a design-focused page full of facts about plastic. The material was first published in 2018 but was updated recently, ensuring all the information is up to date.
We like that these graphics provide a global overview, stating 18 billion pounds of plastics spill into the oceans every year from coastal areas worldwide. This global plastic stat shows the true extent of the plastic problem and how plastics in our oceans, in particular, affect wildlife.
The resource even includes how much plastic production is attributed to packaging, highlighting that a whopping 40% of plastics are used within packaging development. This stat is even more shocking when we think of how plastic isn’t a necessary material in packaging production.
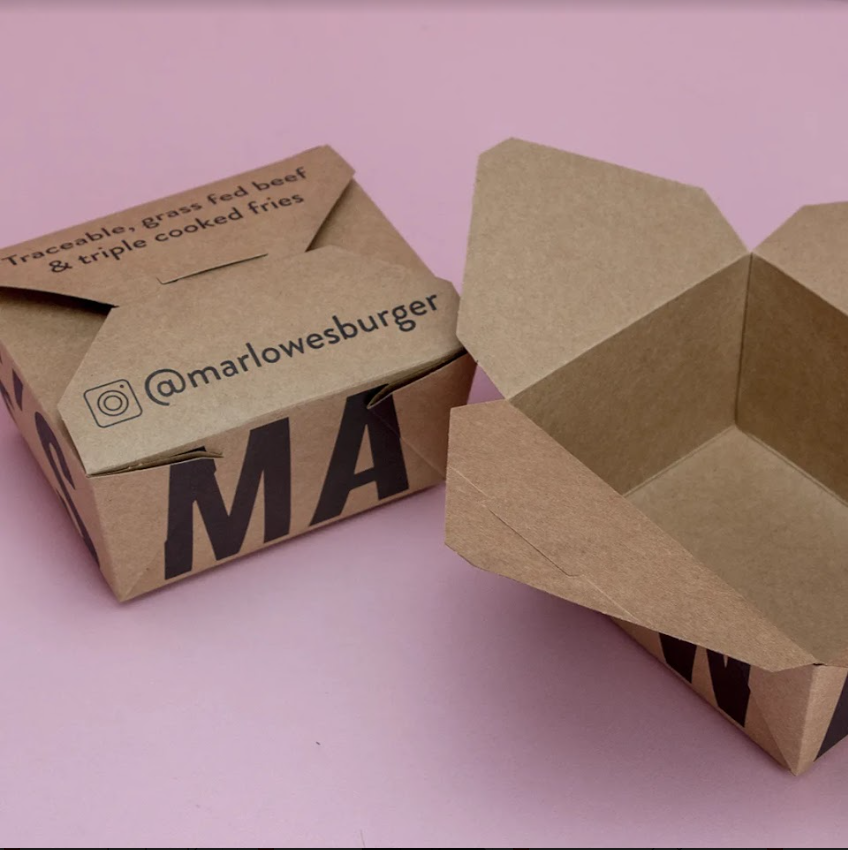
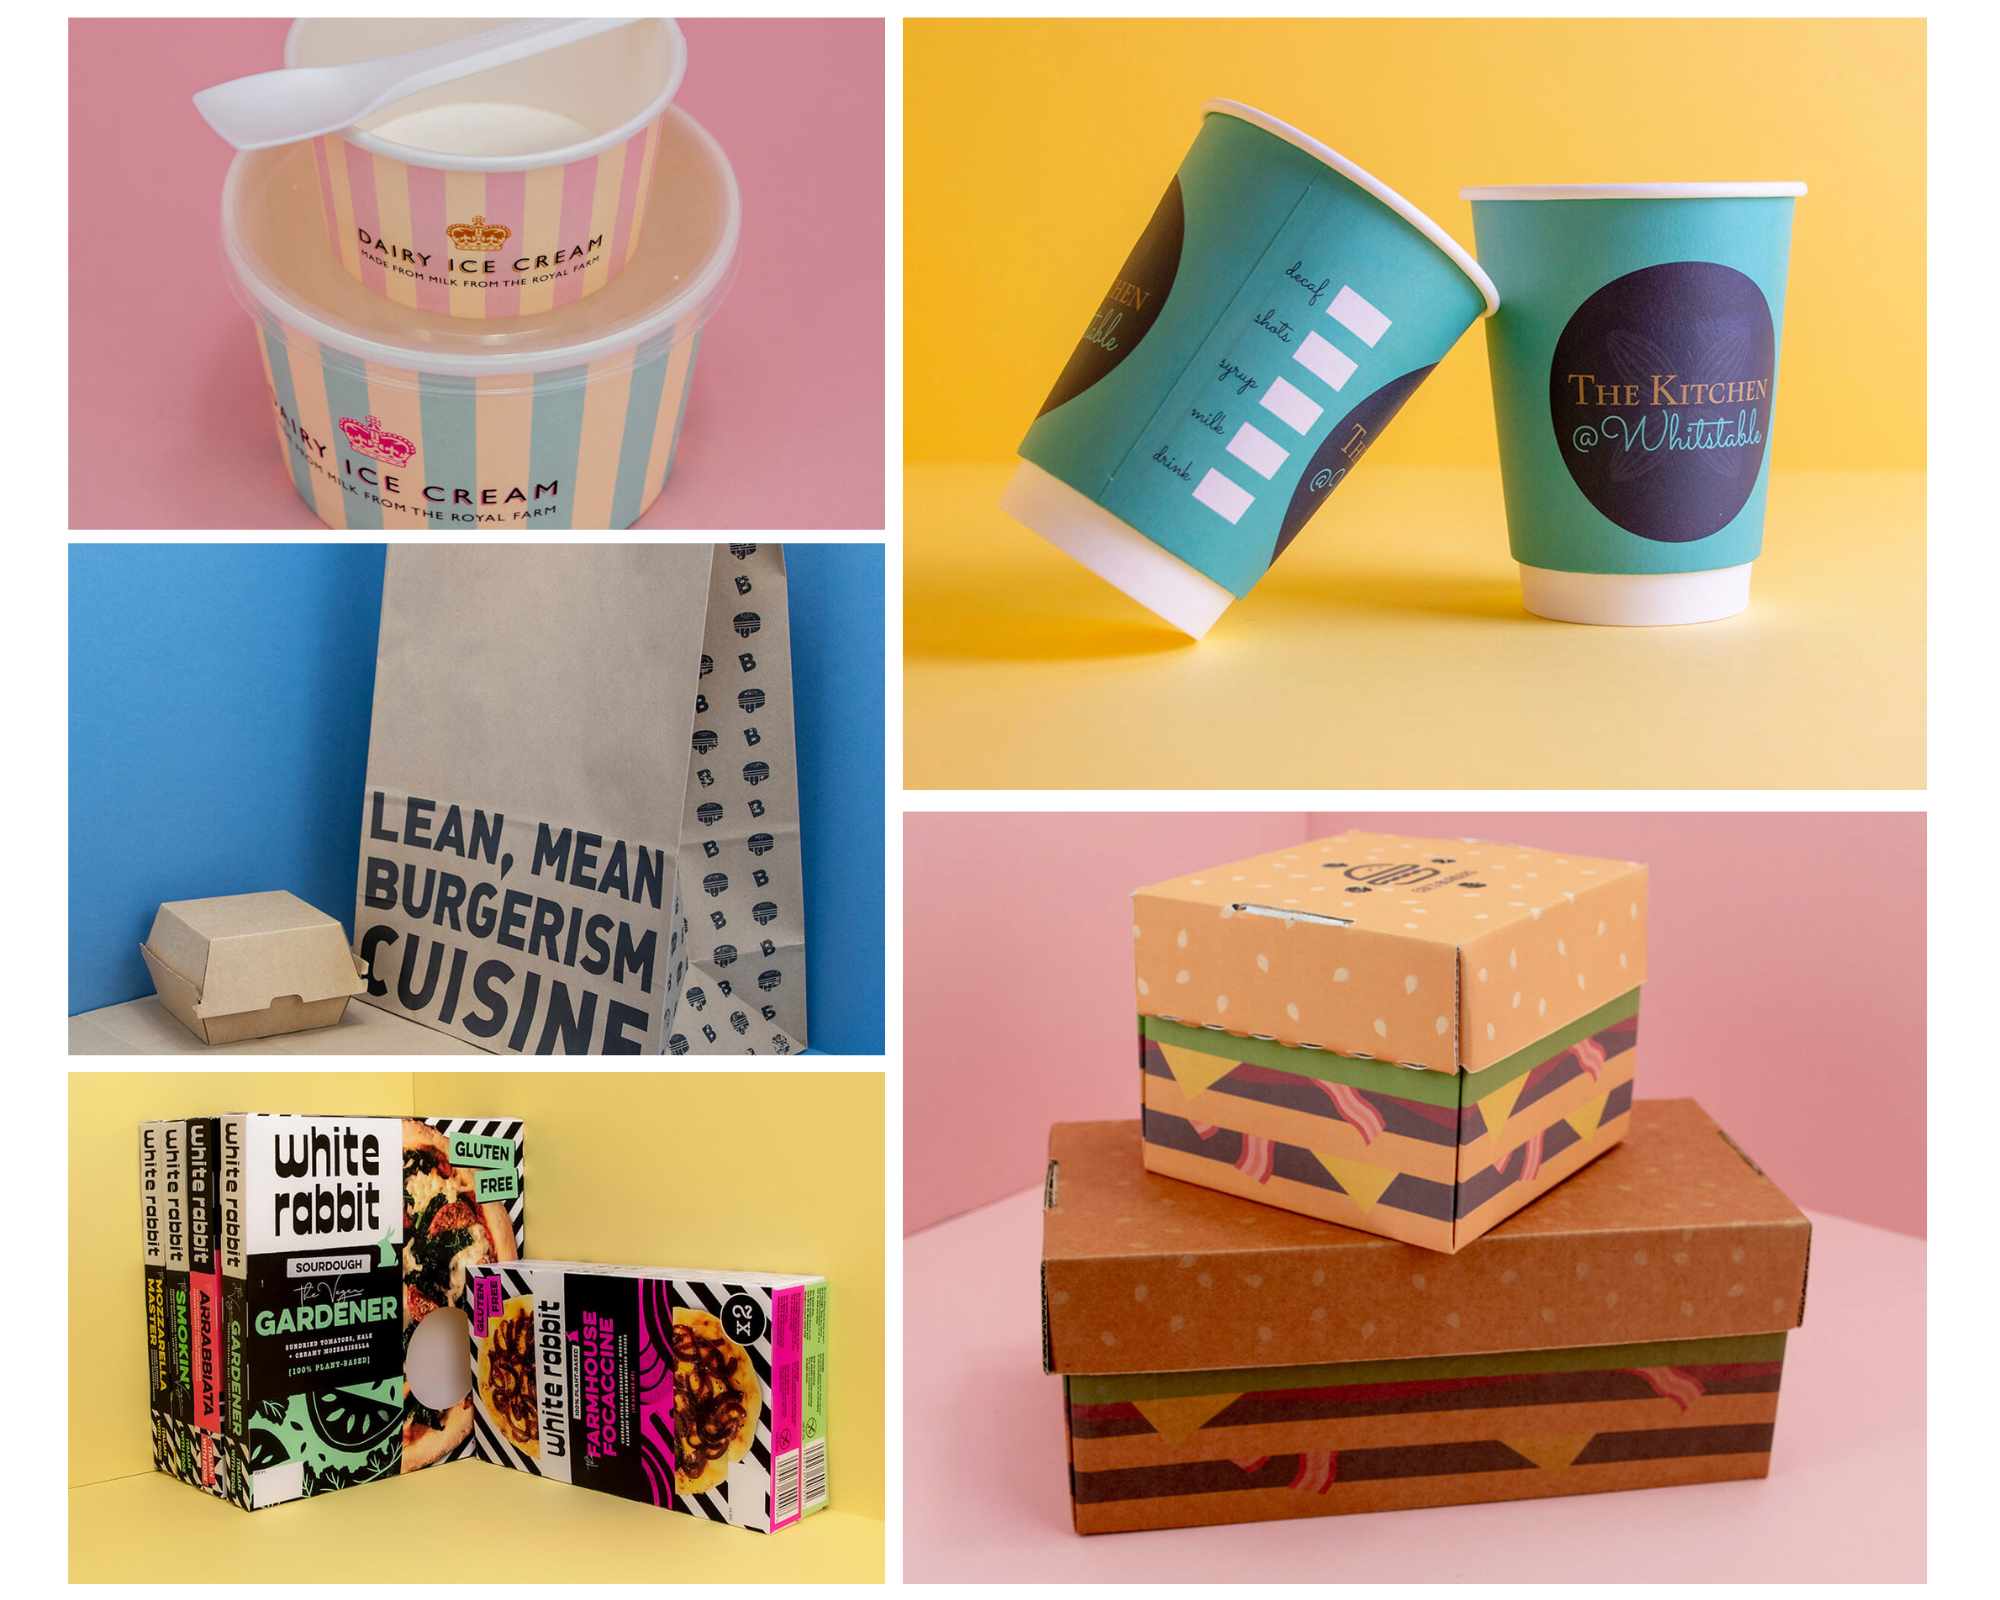
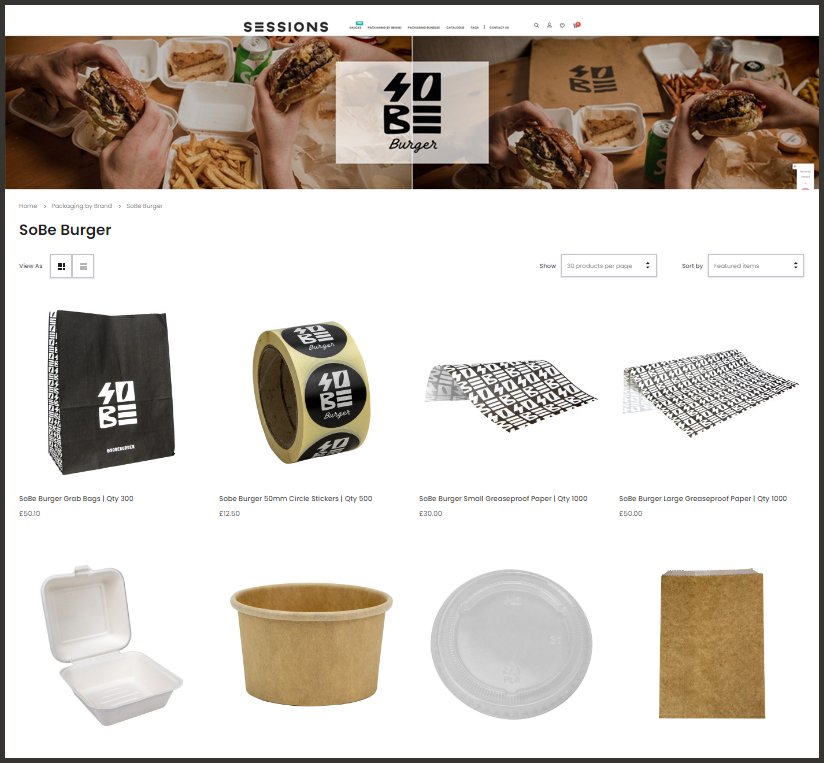
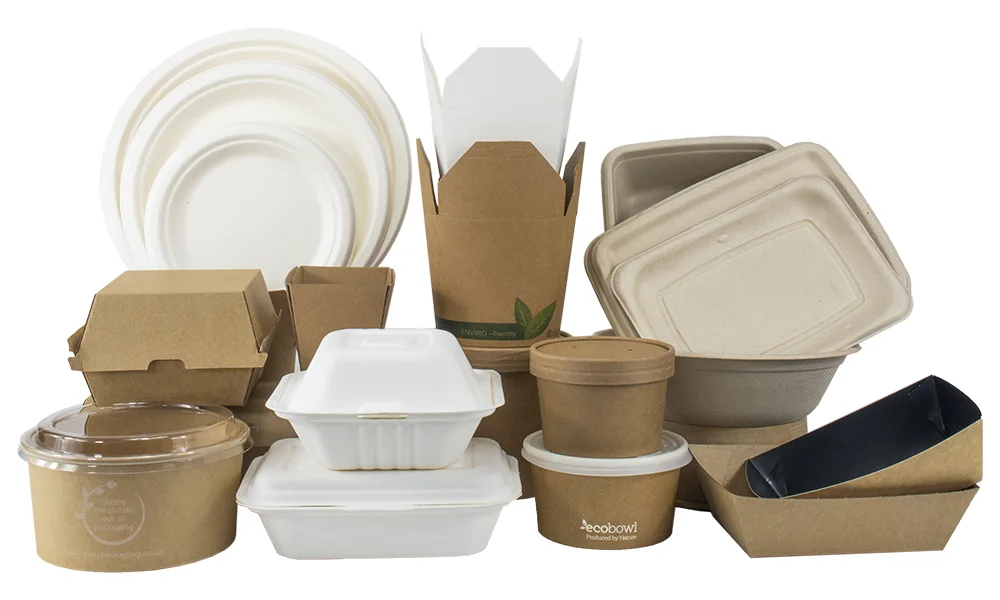
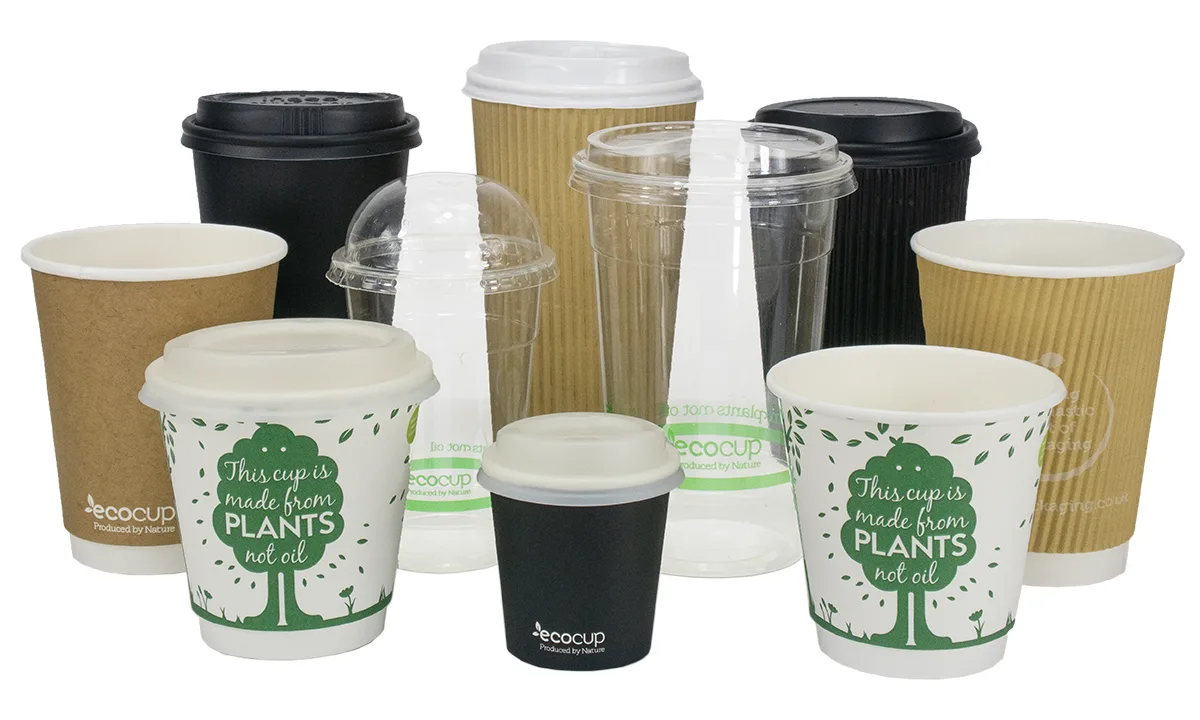
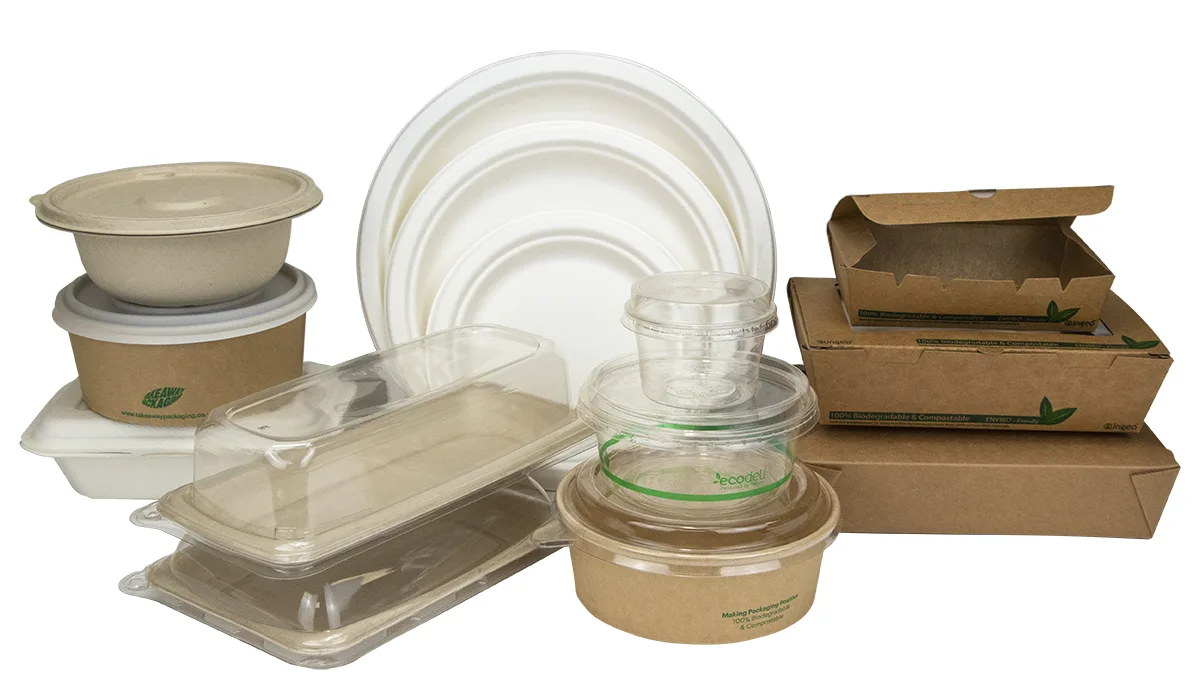
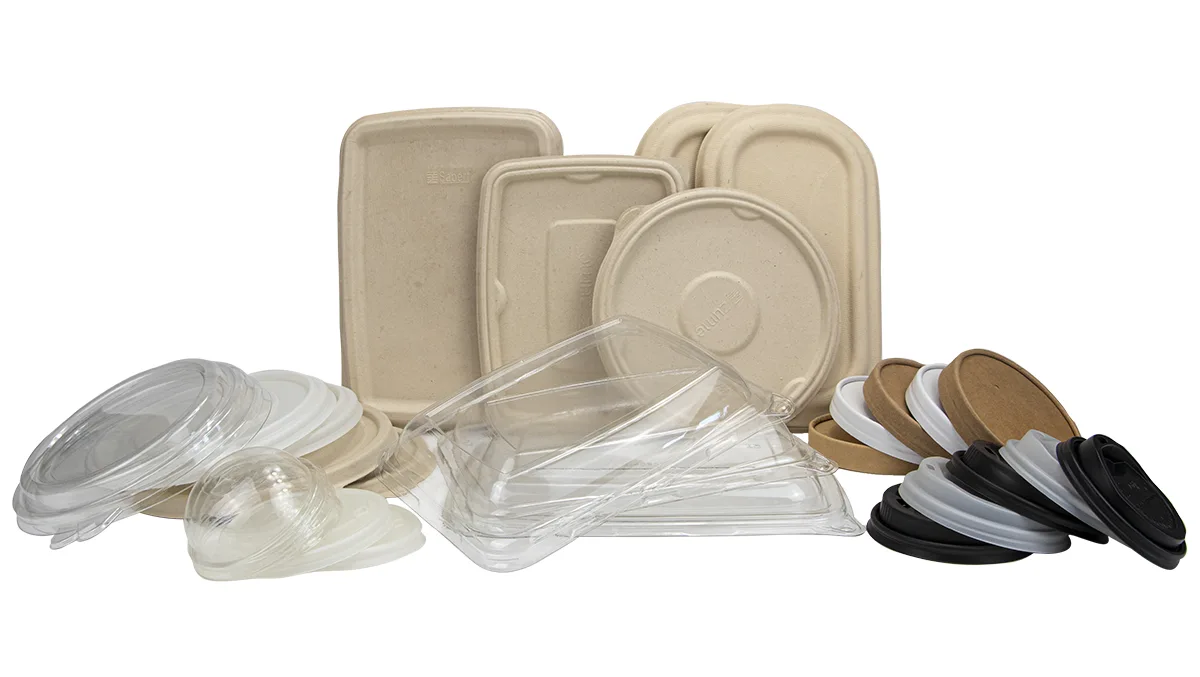
Brands like Takeaway Packaging are committed to finding innovative ways to protect our environment through the packaging materials we use.
Read National Geographic’s Facts about Plastic Pollution
Don’t forget after you’ve finished reading all about plastics, it’s time to take some action. Browse our sustainable shop of packaging products that produce zero plastic waste.